Fig.1 PERCENTILE CHART OF HEIGHT AND WEIGHT FOR GIRLS
Fig.2
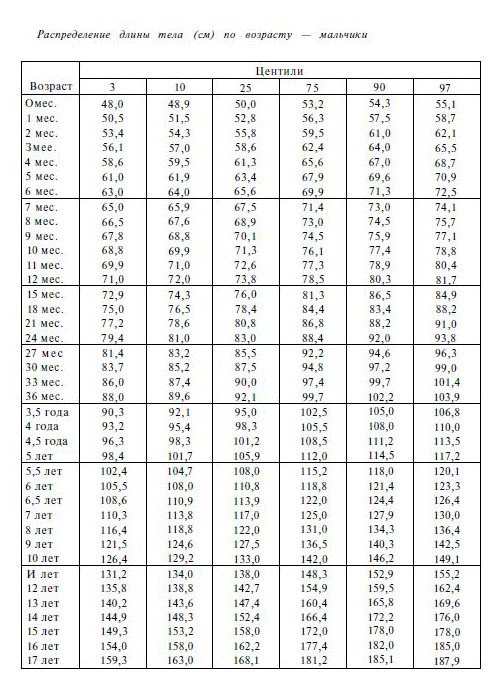
Figures 1 and 2 show height values for boys and girls. For example, a boy is 6 years old and his height is 110 cm. You mark the intersection point of a line drawn upward from the number 6 with a horizontal line at 110 cm and make sure that your child’s height is normal. You also see that at this age, normal, healthy children can be between 108 and 122 cm tall. Another example: A child is 14 years old and his height is 135 cm. You see that his height is below the lower limit of normal. You should immediately consult a doctor to determine the cause of the child’s growth retardation.
ᐉ Centile table of height and weight of a child. Corridors of child development ➡ klass511.ru
› Female beauty
06.01.2020
Very often, pediatricians, having measured the height and weight of the child, tell the mother that her child is in such and such a corridor. What kind of corridor is this? To determine the development corridor, centile tables are used, which distribute children according to increasing indicators of height, weight, chest and head circumference.
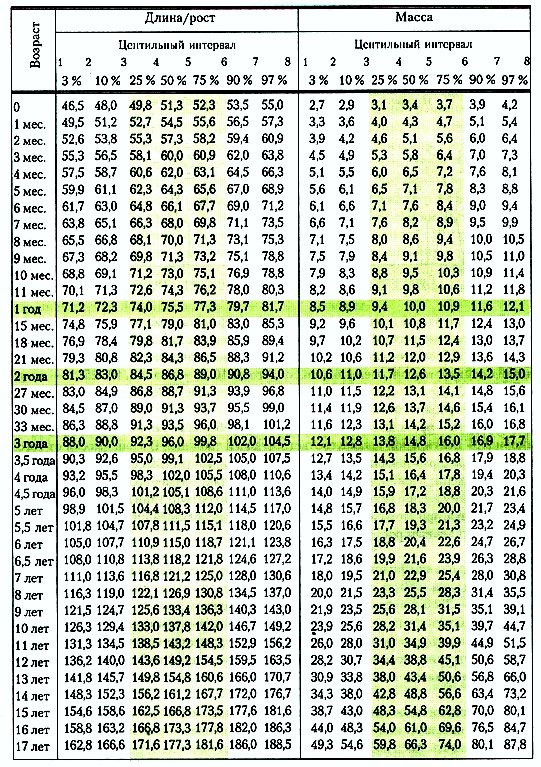
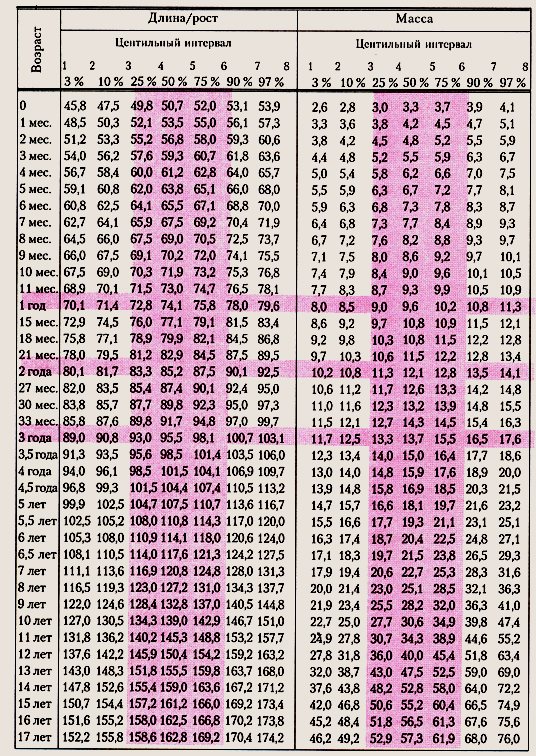
The columns of centile tables show the quantitative boundaries of a trait in a certain proportion (percentage, centile) of children of a given age and gender. Average or strictly normal values are taken to be the values characteristic of half of healthy children of a given sex and age, which corresponds to the range of 25-50-75%.
If the indicator falls into the zone of 3-10 or 90-97%, you should be wary and point this out to your doctor. This is an area of attention that requires additional consultation and examination.
Below are these tables:
Physical development of boys from 0 to 17 years
Physical development of girls from 0 to 17 years
You can also use anthropometric formulas.
1 year of life 6 months 66 cm -1 month -2.5 cm +1 month +1.5 cm 6 months 8000 grams -1 month -800 grams +1 month +400 grams 66 cm 8200 grams -1 cm -300 grams + 1 cm +250 grams 6 months 45 cm (chest) -1 month -2 cm +1 month +0.5 cm 6 months 43 cm (head) -1 cm -1.5 cm +1 cm +05 cm 2 – 16 years 8 years 130 cm -1 year — 8 cm +1 year +5 cm 125 cm 25 kg -7 cm -2 kg +5 cm +3 (3.5) kg 10 years 63 cm (chest) -1 year -1 .5 cm +1 year +3 cm 5 years 50 cm (head) -1 year -1 cm +1 year +0.6 cm 2 – 11 years 5 years 19 kg -1 year -2 kg +1 year +3 kg 12 – 16 years Age*5-20=weight 1 – 6 years 4 years 100 cm -1 year -8 cm
+1 year +6 cm
1 month 4200 g 1 year 11 kg 2 months 5000 g 2 years 13 kg 3 months 5800 g 3 years 15 kg 4 months 6600 g 4 years 17 kg 5 months 7400 g 5 years 19 kg 6 months 8200 g 6 years 22 kg 7 months 8600 g 7 years 25 kg 8 months 9000 g 8 years 28 kg 9 months 9400 g 9 years 31 kg 10 months 9800 g 10 years 34 kg 11 months 10200 g 11 years 37 kg 12 months 10600 g 12 years 40 kg 13 years 45 kg
14 years old 50 kg
At the doctor’s appointment we were given corridor 5, but whether it’s good or bad, what deviations there are, they just shrugged their shoulders. should I worry?
Corridor 5 corresponds to normal physical development
How to use centile tables to assess the physical development of a child
The child is growing every day. In order to assess his physical growth, to understand whether he is developing correctly, there are centile tables.
Pediatricians, observing the baby, regularly assess his weight and size, and advise parents what to do if the child’s parameters differ significantly in one direction or another from the average.
Proper physical development is important for the subsequent life of a little person.
Standard deviation
The standard deviation “σ” (usually denoted by the Greek letter sigma) allows you to evaluate how much values from a set may differ from the average value. Length/height estimation using “σ” is made by calculating standard deviations from 50% of the height indicators for a given age group.
- within ± 1 σ - average growth;
- from ± 1 σ to ± 2 σ — growth below/above average;
- from ± 2 σ to ± 3 σ - low/high growth;
- going beyond +/- 3σ - growth is very high (gigantism)/very low (dwarfism).
Corridors of child development
The development of a child is a very important moment in his life and health, so it is important to correctly assess his physical and mental development. Weight and height play a very important role in physical development, which is why the assessment of the child’s condition begins with them.
After all, it is very important that the weight and height correspond to the age of the child. When assessing a child, an empirical approach is used, that is, they are based on the experience of other children. For assessment, special tables are used, which are based on examination of a large number of children.
Sometimes mothers hear such an expression as child development corridors. Only very few people know what it is. If this is important to you, then you should ask your pediatrician or nurse so that they can tell you in detail.
The help of parents in this matter is very important, because it is the parents who can help the pediatrician make a full assessment of the child; for this it is necessary to monitor the baby’s condition and monitor his development.
The most important anthropometric indicators when assessing a child are height, weight, head and chest circumference, body proportions, and also pay attention to psychomotor characteristics.
It is worth understanding that a child is significantly different from an adult - he grows and develops according to his own laws. The growth of a child is an important indicator of the normal development of the baby. When the baby grows, it means that he is developing normally.
But it is worth considering that the growth process can be influenced by a large number of factors - for example, nutrition.
A baby needs a full range of nutrients, in particular fats, proteins, mineral salts, carbohydrates, vitamins and many other useful substances.
How to determine the child’s development corridor
Every mother should know which corridor her child is in, because the pediatrician often does not have time to keep track of the child. Centile tables are used to determine the development corridor.
Thanks to these tables, children are distributed according to indicators that increase. These are indicators of weight, height, head and chest circumference.
The indicators for boys and girls have significant differences; accordingly, there are tables for both boys and girls separately.
Physical development of girls from 0 to 17 years:
Each column in the presented centile tables shows the quantitative boundaries of a certain characteristic for any share. In this case, age and gender matter. Average are considered indicators that are characteristic of the majority of children of the same sex and age.
These indicators correspond to the intervals of 25-50-75%. If, after measuring your child, the indicators fall into the 3-10% or 90-97% columns, then you should pay attention to this, because these indicators differ significantly from the norm.
This leads to the need to consult a doctor.
Sources:
https://godrebenka.ru/2010/04/136.html https://pediatriya.info/tsentilnyie-tablitsyi-fizicheskogo-razvitiya/ https://pregnote.ru/koridory-razvitiya-rebenka/
Centile table of height and weight of a child. Corridors of child development Link to main publication
Source: https://klass511.ru/zhenskaya-krasota/tsentilnaya-tablitsa-rosta-i-vesa-rebenka-koridory-razvitiya-rebenka.html
What are percentiles (percentiles)?
In English this word means "percentage". The midline—the 50th percentile—is the average height for a given age. The bottom line of the graph is the 3rd percentile (percentile). 3% of children of this age have this height. The top line of the graph is the 97th percentile. 3% of children of this age also have such height, only the 3rd percentile is the 3% of children with the lowest indicators, and the 97th is the 3% of children with the highest indicators for this age. If your child's height is below the 3rd percentile or above the 97th percentile, you should definitely consult a doctor.
Using the tables, you can find out whether your child’s height and weight at a given age (from birth to 17 years) are normal. Centile tables are given below.
Roughly speaking, 3 middle columns are considered the norm, but this is not the main thing. It is important that the centile corridor does not change sharply. For example, if at 2 months the baby’s weight is 6, and at 3 months – 3, or vice versa, there is a high probability of health problems and the baby needs to be examined.
Centile tables of physical development of girls:
Dental tables for assessing the physical development of a child represent a kind of “mathematical photograph” of the distribution of a large number of children according to increasing indicators of height, weight, chest and head circumference. The practical use of these tables is extremely simple and convenient, combined with a good logical understanding of the assessment results.
The columns of centile tables show the quantitative boundaries of a trait in a certain proportion (percentage, centile) of children of a given age and gender. In this case, the values characteristic of half of healthy children of a given sex and age are taken as average or strictly normal values, which corresponds to the interval 25-50-75%. In our tables this interval is shaded. Intervals that are close to the average are assessed as below and above average (10-25% and 75-90%, respectively). These indicators can also be regarded by parents as normal. If the indicator falls into the zone of 3-10 or 90-97%, you should be wary and point this out to your doctor. This is an area of attention that requires additional consultation and examination. If the child’s indicator goes beyond 3 or 97%, it is very likely that the child has some kind of pathology that affects the indicators of his physical development. distribution of children by head circumference
You can understand what a dental scale is, for example a height scale, using the following example. Imagine 100 children of the same age and gender, lined up in height from smallest to tallest. The height of the first three children is assessed as very low, from 3 to 10 - low, 10-25 - below average, 25-75 - average, 75-90 - above average, 90-97 - tall and the last three guys are very tall.
The indicator of height, weight, etc. of a particular child can be placed in its own “corridor” of the centile scale of the corresponding table. Depending on which “corridors” the child’s anthropometric data fall into, a value judgment is formulated and an appropriate tactical medical decision is made.
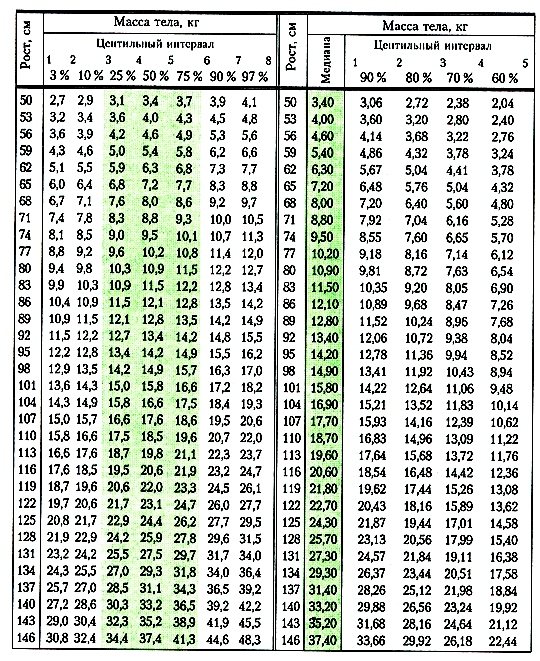
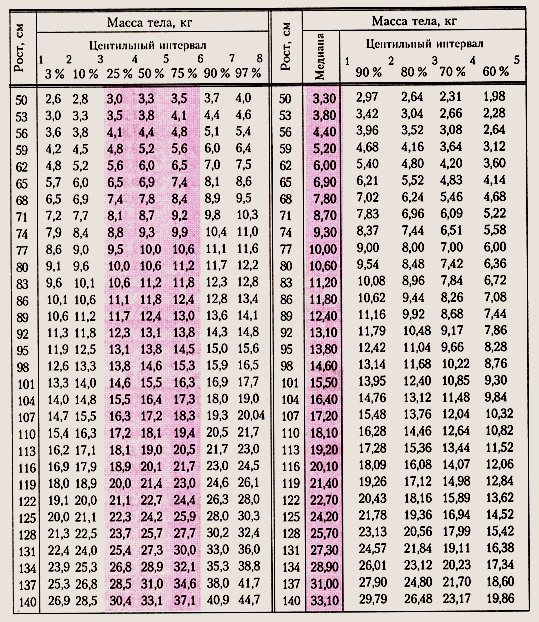
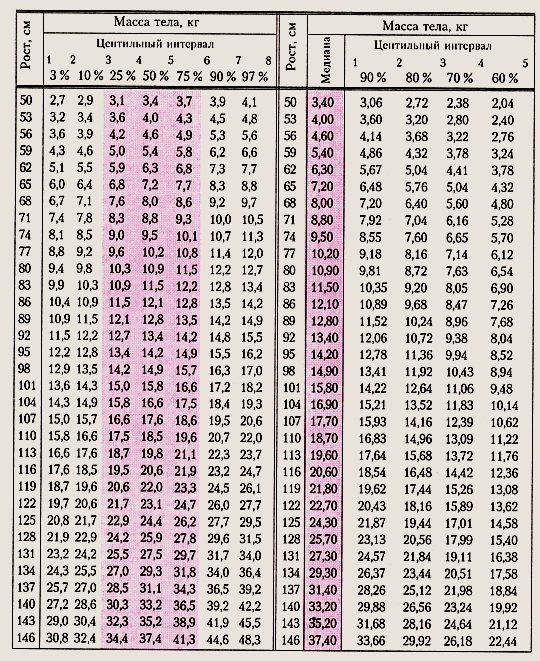
The same principle is used to assess the correspondence of body weight to the length and height of a child, while the distribution is constructed using weight indicators for children of the same height.
Each child is individual - this is no secret. However, there are indicators that in certain children should correspond to average statistical standards. Such parameters help the doctor determine the possible presence of problems with physical and mental development, as well as suggest the presence of any disease.
Assessing a child is a very important moment for any doctor and, of course, for parents. What do all these scales, ratings and tables mean in a child’s life and where do they come from?
Assessment of risk factors for premature infants in the first year of life
Sigma and percentile type tables are used.
Vertically - indicators of weight, length, head and chest circumference, horizontally - his gestational age. If the intersection point of these lines is located between the P25-50-75 curves, the indicator corresponds to the norm, if P10 is 25 and 75-90, then the indicators are above and below average.
Having brought your baby to an appointment with a pediatrician, who will weigh her and measure her height, chest and head girth, you hear an assessment of these indicators: a four, or another number from one to eight. What are these points? This is the centile corridor
, which contains your girl’s indicators according to the table.
Using the tables, you can find out whether your child’s height and weight at a given age (from birth to 17 years) are normal. Centile tables are given below.
Roughly speaking, 3 middle columns are considered the norm, but this is not the main thing. It is important that the centile corridor does not change sharply. For example, if at 2 months the baby’s weight is 6, and at 3 months – 3, or vice versa, there is a high probability of health problems and the baby needs to be examined.
Dental tables for assessing the physical development of a child represent a kind of “mathematical photograph” of the distribution of a large number of children according to increasing indicators of height, weight, chest and head circumference. The practical use of these tables is extremely simple and convenient, combined with a good logical understanding of the assessment results.
The columns of centile tables show the quantitative boundaries of a trait in a certain proportion (percentage, centile) of children of a given age and gender. In this case, the values characteristic of half of healthy children of a given sex and age are taken as average or strictly normal values, which corresponds to the interval 25-50-75%. In our tables this interval is shaded. Intervals that are close to the average are assessed as below and above average (10-25% and 75-90%, respectively). These indicators can also be regarded by parents as normal. If the indicator falls into the zone of 3-10 or 90-97%, you should be wary and point this out to your doctor. This is an area of attention that requires additional consultation and examination. If the child’s indicator goes beyond 3 or 97%, it is very likely that the child has some kind of pathology that affects the indicators of his physical development. distribution of children by head circumference
You can understand what a dental scale is, for example a height scale, using the following example. Imagine 100 children of the same age and gender, lined up in height from smallest to tallest. The height of the first three children is assessed as very low, from 3 to 10 - low, 10-25 - below average, 25-75 - average, 75-90 - above average, 90-97 - tall and the last three guys are very tall.
The indicator of height, weight, etc. of a particular child can be placed in its own “corridor” of the centile scale of the corresponding table. Depending on which “corridors” the child’s anthropometric data fall into, a value judgment is formulated and an appropriate tactical medical decision is made.
The same principle is used to assess the correspondence of body weight to the length and height of a child, while the distribution is constructed using weight indicators for children of the same height.
Centile tables for boys, like those, are intended to determine the level of physical development of a child in the context of existing standards. Using them, you can determine how your child fits into the statistics of his generation.
Baby up to one year old
After the baby turns one month old, the mother must take the baby to routine appointments with the pediatrician. This happens according to schedule when the baby turns:
- one month;
- three months;
- six months;
- nine month;
- twelve months.
At these appointments, it is mandatory to assess physical development using centile tables. They also record the age when the child began to smile, sat down for the first time, stood up, took the first steps, said the first word, and the timing of teething. Measure:
- Body length.
- Head volume/circumference.
- Chest size.
- Body temperature.
- The size of the fontanel.
Based on these data and possible complaints from the mother, the child may be sent for additional tests or to see a specialist. In other cases, physical development is assessed using centile tables. According to these tables, the development norm is always considered to be in the middle corridors, that is, in the range of 25-75 percent. But a child can also develop quite normally if the data for all indicators are in the same range, below or above the statistical average (in this case they talk about body features).
Physical development of girls from 0 to 17 years:
Each column in the presented centile tables shows the quantitative boundaries of a certain characteristic for any share. In this case, age and gender matter. Average are considered indicators that are characteristic of the majority of children of the same sex and age. These indicators correspond to the intervals of 25-50-75%. If, after measuring your child, the indicators fall into the 3-10% or 90-97% columns, then you should pay attention to this, because these indicators differ significantly from the norm. This leads to the need to consult a doctor.
Centile tables. Tables of height, weight, head circumference, chest circumference.
What are centile tables?
Centile
– an indicator of a certain parameter, in our example of growth, which has a certain number of subjects.
Using centile tables, you can determine how a child is developing. Roughly speaking, they took 100 children aged 1 year and measured their height. Half of the children - 50% were 75 cm tall, they fell into the middle column (corridor) of the table marked 50 percent or “average value”, those who were shorter or taller than the majority fell into the columns to the left and right of the center. Shorter to the left, taller to the right. In the outermost columns were the shortest, and the most elongated for their age, in comparison with the rest. The outermost bars represent 3-5% of the total number of children measured.
The labeling of the tables may be different, the tables may be presented in the form of graphs (examples are given below), but the essence is the same, in the center is the average value (half, majority), at the edges are areas of very low values or very high values.
How to use centile tables?
It seems that everything is clear, you are in the far left column, which means that your height is below average and you belong to 3% of the population with the same height in this age category. You are in the first column to the right from the middle, which means your height is slightly above the norm; you make up 25% of the population.
How to evaluate development, height, weight using centile tables?
The simplest thing is to look at how many columns (corridors) the indicators are located within. That is, to determine the proportionality of development - the proportionality of anthropometric data.
Determine the indicators of height, weight, head and chest circumference and see which columns they belong to. If all indicators are within the same corridor or the difference is no more than one column, we can talk about harmonious development. If the difference between the parameters, two columns indicate disproportionate or disharmonious development, and three or more columns indicate sharply disharmonious development.
Is it possible to make a diagnosis using centile tables?
Centile tables are conditionally normative values.
For example, if you fall into the area of very high values or disharmonious development is identified, your doctor may refer you for additional consultations.
What to do if the indicators are higher than normal or disproportionate?
Do not panic. If this is a disease, it will be detected during further examination. But this may well be a variant of the norm. Look at the tables and graphs given in the article; measurements taken in different countries and on different groups of people differ. And this is natural, because the average Western European is taller than the average Chinese. Therefore, ask what tables (whose production) you use when assessing parameters. Secondly, this is heredity, from which you cannot escape, if mom and dad have a large head relative to the body, then you should not faint if the pediatrician notices that their child has disproportionate development, with a large head relative to the body. Just remember - a deviation from the norm relative to standard charts is not a diagnosis, it is just a reason to pay attention.
As for such a parameter as weight in infants, weight in children
– if at exactly 3 months the child has gained 200 grams more or less than the norm according to the schedule, this is not a reason to take action. The child grows in leaps and bounds; throughout the month he has different appetites and moods. At different periods, he assimilates food that is often new to him in different ways and adapts to environmental conditions. Based on this, it is wrong to expect a certain indicator at a certain moment of measurement. The main criteria for a baby are behavior and sleep, healthy appearance, appropriate growth and... normal stool and comparison of anthropometric indicators with previous ones. And 100 grams of weight does not play a special role.
height and age of a girl from birth
Hello, dear readers!
What do you think new parents worry about? After all, after the birth of a baby, the life of young fathers and mothers changes in the most miraculous way - delight and tenderness are replaced by the daily work of caring for a newborn. This is where the first fears and worries begin. During scheduled monthly visits, a pediatrician’s head is bombarded with a lot of questions.
How much has the baby gained in height and weight? As a rule, the main concerns of “inexperienced” parents are the compliance of these indicators with the generally accepted norm. I admit, at one time I was also tormented by doubts about the above-mentioned indicators. However, the doctor reassured me - there is a table for the development of a child up to one year, which shows the norms for height, weight, as well as the increase in indicators for each month.
So, let's take a fascinating journey from the moment the baby is born until he is one year old. After all, kids grow up so fast! And how many skills little “researchers” master during this period - just keep up with them!
When I first heard about this term from my local pediatrician, I didn’t immediately understand what was going on. However, there is nothing “scary” here - we are talking about anthropometric indicators for assessing the child’s development (height, weight, head and chest circumference).
“Your baby’s height is in the fifth corridor,” says your “children’s” doctor. This means that the child's height, which is assessed using a special centile table, is average.
It is noteworthy that the normative indicators for boys and girls are slightly different.
At the next scheduled examination, the pediatrician takes all the necessary measurements, compares them with the data in the tables and, on this basis, makes a conclusion about the child’s development. Today, if desired, mothers can find these signs on special thematic websites. However, it’s still better to consult a pediatrician, isn’t it? The doctor will teach you how to use centile tables correctly, and will also “dispel” possible doubts and worries.
For example, indicators corresponding to the intervals of 25 – 50 – 75% are considered average. And if, after measurements and assessments, the baby is classified as 3 - 10% or 90 - 97%, then this is a reason to be wary and immediately consult a doctor.
Centile tables for boys up to one year old
To measure the growth of a baby up to one year old, the clinic uses a special board with sides. The baby's head is pressed against one of them, and the legs are pressed against the other.
| age , in months | Boy's height | ||||||
| Centile interval, % | |||||||
| newborn | |||||||
Centile tables for boys and girls also contain data. Non-compliance with standards for this parameter is a reason to refer the child to a neurologist.
| age , in months | Boy's head circumference | ||||||
| Centile interval, % | |||||||
| newborn | |||||||
What are centiles and centile tables in pediatrics
The principle of these tables is that centiles divide values into 100 intervals, most often used: 3, 10, 25, 50, 75, 90 and 97th. Centiles are data on values (height, weight, head and chest circumference) that a certain number of children being examined have. They are used to quickly assess how a child is developing, whether his data corresponds to the norm (the average value characteristic of most children at a particular age). The norm is considered to be the number of signs characteristic of half of healthy boys and girls, that is, the interval from 25 to 75 centiles. The standard is considered to be a sign of physical development, defined as the 50th centile.
Mandatory for assessing the physical development of children after one year
Assessment of the physical development of children after one year is carried out according to the following indicators:
- Somatic indicators (weight in kg, height in cm, in cm).
- Somatoscopic indicators (condition of the skin, mucous membranes, development of subcutaneous fat deposits, development of the musculoskeletal system, level of sexual development).
- Physiometric indicators (muscle strength, lung capacity, blood pressure, pulse rate).
- General health (past illnesses, presence of chronic illnesses).
Methods for assessing physical development are strictly unified, since only by taking measurements under the same conditions and with the same instruments can we talk about the comparability and reliability of the research results.
Physical development of young children
The early age of a child is the period from one to three years. The physical development of young children is characterized by intensity. During this period, there is a significant increase in height and weight indicators, active growth and development of internal organs, and intensive development of the motor sphere.
Weight and height
Every month, a child aged one to two years gains about 200-250 grams in weight and grows by about one centimeter. Growth slows down slightly in the third year of life and is about 8 cm and 2.5 kg of weight per year. The slowdown is due to the fact that most of the energy during this period is aimed at the development of internal organs and systems, as well as active motor activity.
Physical activity
The development of the musculoskeletal system in young children is characterized by the processes of bone tissue mineralization and normalization of muscle tone. The child’s body acquires the desired stability in an upright position, complex movements using force become feasible, and fine motor skills improve. The period from 2 to 3 years is when physical activity peaks.
Development of internal organs
At an early age, intensive development of the central nervous system occurs, which allows the child to concentrate his attention on one subject for a long time.
The periods when the child is awake increase to six to eight hours. In addition, the functioning of the digestive system changes, intestinal tone increases, and peristalsis increases. Among the changes affecting the excretory system, it is worth noting an increase in the volume of the bladder by two to three times.
Somatic indicators
Assessment of a child’s physical development often occurs in this way: somatic indicators of the development of a particular child are compared with centile tables according to age and gender. You can see what these tables for boys look like below.
Boy's age | Boy's height | ||||||
| Centile interval, % | |||||||
For girls it's a little different. Until two years of age, they are usually slightly smaller than boys, but after that they catch up and even outstrip in growth.
Girl's age | Girl's height | ||||||
| Centile interval, % | |||||||
Study of somatoscopic indicators
Methods for assessing physical development include a number of basic measurement indicators. They can be studied in the following table.
| Sign | Options | Norm | Note |
| Fat deposition | Abdominal fat thickness | Laterally at the level of the navel and under the shoulder blade | |
| Shape and features of chest development | Cylindrical, flat, conical, mixed, rachitic, barrel-shaped | Cylindrical | Sometimes in young children a mixed chest type may be considered normal. |
| Thin, chunky, in-between | |||
| Spine | Normal, kyphotic, lordostic | Normal - has an s-shape in the sagittal plane | Scoliosis is also a spinal deformity |
| Leg shape | Vaulted, flat, flattened | Vaulted (normal) |
Physical development of children of senior school age
At high school age, puberty ends and both gender and individual differences in body structure clearly appear. In addition, it is observed:
- slowing body height growth;
- body weight gain;
- completion of ossification of most of the skeleton;
- thickening of tubular bones;
- active development of the chest;
- rapid and uniform muscle development.
If you want to find out how well your child’s physical development is progressing, contact the CELT multidisciplinary clinic. We employ pediatric specialists who have extensive experience. They will assess the physical development of your child, provide you with all the necessary information and advise you on issues that interest you.
Make an appointment through the application or by calling +7 +7 We work every day:
- Monday—Friday: 8.00—20.00
- Saturday: 8.00–18.00
- Sunday is a day off
The nearest metro and MCC stations to the clinic:
- Highway of Enthusiasts or Perovo
- Partisan
- Enthusiast Highway
Driving directions
Physiometric indicators
Assessment of the physical development of schoolchildren occurs, among other things, by measuring the functional indicators of the body:
1. Vital capacity (volume) of the lungs is an indicator of the strength of the respiratory muscles and lung volume. The measurement is carried out using an air spirometer or a water spirometer. Age indicators for children of different genders and ages will differ.
| Age | ||||
| Girls | Boys | |||
| Volume, ml | Force | Volume, ml | Force | |
2. Arm muscle strength - the degree of muscle development. The measurement is carried out with a device called a hand dynamometer. 3. Deadlift strength - the strength of the body extensor muscles in the hip joints. 4. HR - heart rate.
5. Blood pressure begins to be measured after seven years. Normally, from this age, systolic (upper) should be within 100-120 mm Hg. Art., and diastolic (lower) - 60-80 mm Hg. Art.
Assessment of physical development according to these indicators is made by comparing individual indicators and average values typical for a given age and gender group of children.
Tables of physical development norms for children from 0 to 18 years old – Sovushka
Having brought your son to an appointment with a pediatrician, who will weigh him and measure his height, chest and head circumference, you hear an assessment of these indicators: a four, or another number from one to eight. What are these points? This is the centile corridor (or centile interval) , in which your boy’s indicators are located according to the table. Centile tables are given below.
Roughly speaking, 3 middle columns are considered the norm, but this is not the main thing. It is important that the centile corridor does not change sharply. For example, if at 2 months the baby’s weight is 6, and at 3 months – 3, or vice versa, there is a high probability of health problems and the baby needs an examination.
Dental tables for assessing the physical development of a child represent a kind of “mathematical photograph” of the distribution of a large number of children according to increasing indicators of height, weight, chest and head circumference. The practical use of these tables is extremely simple and convenient, combined with a good logical understanding of the assessment results.
The columns of centile tables show the quantitative boundaries of a trait in a certain proportion (percentage, centile) of children of a given age and gender. In this case, the values characteristic of half of healthy children of a given sex and age are taken as average or strictly normal values, which corresponds to the interval 25-50-75%. In our tables this interval is shaded.
Intervals that are close to the average are assessed as below and above average (10-25% and 75-90%, respectively). These indicators can also be regarded by parents as normal. If the indicator falls into the zone of 3-10 or 90-97%, you should be wary and point this out to your doctor. This is an area of attention that requires additional consultation and examination.
If the child’s indicator goes beyond 3 or 97%, it is very likely that the child has some kind of pathology that affects the indicators of his physical development. distribution of children by head circumference You can understand what a dental scale, for example height, is using the following example.
Imagine 100 children of the same age and gender, lined up in height from smallest to tallest. The height of the first three children is assessed as very low, from 3 to 10 - low, 10-25 - below average, 25-75 - average, 75-90 - above average, 90-97 - tall and the last three guys are very tall. Indicator of height, weight, etc.
a particular child can be placed in his own “corridor” of the centile scale of the corresponding table. Depending on which “corridors” the child’s anthropometric data fall into, a value judgment is formulated and an appropriate tactical medical decision is made.
The same principle is used to assess the correspondence of body weight to the length and height of a child, while the distribution is constructed using weight indicators for children of the same height. An example of assessing the physical development of a newborn boy. Height-length - 50 cm, corresponds to “average” indicators. Weight - 3800 g, corresponds to the rating of “above average”.
Chest circumference - 37 cm, corresponds to the rating "wide". Head circumference - 36cm, corresponds to “average” values. The correspondence of weight to the length of the child’s body is a moderate excess of weight relative to length, “above average.”
To assess the sufficiency of nutrition in schoolchildren, one should use centile scales of the Quetelet index, which most objectively identifies both insufficiency and excess of body weight relative to height and depends little on the characteristics of the child’s physique and constitution.
: 5 / 5
Source:
Centile tables of physical development for boys and girls, what are centiles, how is the assessment carried out
When you and your child come to your local pediatrician for your next preventive examination, the doctor must weigh the baby and also measure his height (body length) and girth (chest, head).
Why is this being done? To compare the obtained measurements with the data of centile tables and determine whether the child’s development corresponds to the age of the child, whether his figure is proportional, whether all parts of his body are growing harmoniously.
This method is quite simple, but it allows you to timely identify deviations in the baby’s physical condition and take measures to correct the situation. What are centiles? And how can you use them to determine whether a child is developing correctly?
Centile tables of physical development are...
The centile method is one of the ways to assess the physical development of children. It involves comparing the anthropometric data of one specific child with the average statistical results obtained during mass examinations (from measurements of the same values in a certain number of children with the same age indicators).
Centile tables provide information on measurements:
- height (or body length);
- weight (or mass);
- circumference (or girth) of the head;
- circumference (or girth) of the chest.
To compile centile tables, studies are carried out on 4 parameters: body length, weight, head circumference and chest circumference
All indicators take into account the age the children ; both the values and their relationship one another are subject to assessment : this way you can determine not only whether child’s height , weight and other indicators correspond to his age , but also whether his body harmoniously formed and growing .
Based on centile tables, development curves are also compiled - graphs that clearly demonstrate changes in anthropometric parameters over time. Research is carried out separately for boys and girls, since the values depending on gender can differ significantly.
After taking measurements and comparing the obtained data with centile tables, the doctor determines an assessment of your baby’s development indicators. The range of scores is from one to eight.
What are centiles (percentiles)
The principle of compiling centile tables is as follows: they include anthropometric data of children (necessarily healthy, whose care meets all the requirements of the World Health Organization) depending on age categories.
For example, measurements of body length (weight, head circumference, chest) of 100 children (or 100%) participating in the study are arranged in ascending order - from smallest to largest.
Children's data is entered into tables according to this scheme
Indicators are recorded:
- third (or 5);
- tenth;
- twenty-fifth;
- fiftieth;
- seventy-fifth;
- ninetieth;
- ninety-seventh (or 95) child (or % of children).
And they keep the same numbering. These are centiles (or percentiles) - indicators of parameters that a certain number of subjects have.
Current WHO standards
In 2005, WHO (World Health Organization) experts compiled and approved correspondence tables (centile), which are recommended for use in modern pediatrics. They were based on the results obtained during the MIER 1997–2003. (Multifocal Study on Growth Standards).
During the implementation of the project, a large number of healthy children of different nationalities living in different climatic zones were examined. Their anthropometric data were systematized, analyzed and entered into tables.
Today, it is the data from these studies and the centile tables compiled on their basis that are considered to be the standard with which pediatricians around the world compare the compliance of children’s development with age standards.
Photo gallery: WHO data on child development
WHO data on child development - height-for-age (girls) WHO data on child development - height-for-age (boys) WHO standards - weight, children from birth (girls) WHO standards - weight, children from birth (boys)
Distribution of body length, weight (mass), chest and head circumferences by age in boys
Height in medicine is considered the most stable indicator, reflecting the harmony and correctness of a child’s development relative to his age. An increase in the absolute length of the body provides, accordingly, for the growth of all its organs and the development of all its systems, as well as the formation of functions in accordance with the course of a particular time period.
A child whose skeletal growth is slowed down for some reason is at the same time, to a greater or lesser extent, susceptible to slower growth of muscles, internal organs, brain, etc.
Throughout life, people grow unevenly:
- the first year of life after birth accounts for the greatest growth energy - during this period the child adds an average of 25 cm to his body length;
- up to 17 years of age - active growth phase (growth occurs, sometimes increasing, sometimes slowing down);
- after that, growth gradually slows down.
As a rule, boys are born larger, their weight and height are greater, and their development occurs under the influence of male sex hormones. Therefore, the values in the tables for boys differ from the results of measurements taken for girls.
Graph: Height-for-age percentiles - boys 0 to 36 months
Body weight in children is the most variable (labile) indicator. It is capable of increasing or decreasing in a short time under the influence of a variety of reasons (not only physiological, but also psychological). The greatest weight gain occurs in the first 3 months after the birth of the child.
Table: weight according to age (boys)
Graph: weight-for-age percentiles - boys under 36 months
Table: correspondence of head circumference to age (boys)
Graph: Head circumference-for-age percentiles - boys 0 to 36 months
Table: correspondence of chest circumference to age (boys)
Proportionality Chart: Weight for Height Percentiles - Boys 0 to 36 months
Distribution of body length, weight, chest and head circumferences by age in girls
Due to physiological characteristics and the influence of female sex hormones on the development of girls, the numbers in the tables for girls differ markedly from those indicated in the centile tables compiled for boys. The difference can be seen from birth. This is normal and natural.
Table: centile for girls (height)
Graph: Height-for-age percentiles - girls 0 to 36 months
Table: centile for girls (weight)
Graph: weight-for-age percentiles - girls 0 to 36 months
Table: centile for girls (head circumference)
Head circumference-for-age percentiles—girls 0 to 36 months
Table: centile for girls (chest circumference)
Proportionality Chart: Weight for Height Percentiles - Girls 0 to 36 months
To assess the correspondence of your child’s anthropometric data to his age, you can use the tables provided. But remember that only a specialist can draw any conclusions.
How to use and evaluate using centile tables
To assess whether the child’s development corresponds to his age, find in the table (depending on the baby’s gender) the line where his age is indicated - full months or years. And, moving along this line, stop at its intersection with the column containing anthropometric data (height, or weight, or any of the circumferences - head, chest), previously measured by you from your son or daughter.
Using centile tables is not at all difficult: find your child’s age in the column on the left and in this line look for numbers that correspond to your measurements
Having found the desired value, pay attention to which column it is in - which centile interval (corridor) it belongs to. This value determines how harmoniously (proportionally) the child develops.
Table: interpretation of centiles
Centile tables are only conditionally normative documentation. One of the tools that simplifies the work of a pediatrician, but no one makes diagnoses based only on the numbers indicated in them.
What to do if the readings are higher or lower than normal
If, through the use of centile tables, a discrepancy between the child’s anthropometric data and his age indicators has been identified, parents should definitely contact their local pediatrician to identify the cause of deviations in his physical development. But remember that not always being too short or too tall, for example, or having a large or small head circumference, etc., can be evidence of pathology.
Source: https://sovushka-zheldor.ru/razbor/tablitsy-norm-fizicheskogo-razvitiya-detej-ot-0-do-18-let.html
A comprehensive method for assessing physical development
All previously discussed methods take into account only morphological data for assessing development, but for a growing person it is natural and necessary to take into account biological development. The complex method includes:
- Assessment of biological age (the degree of correspondence to the age of maturation of the child’s systems and organs). Criteria: weight gain and body length per year, age based on the number of teeth, puberty, development of the bone apparatus.
- according to the ratio of the shape of the legs, abdomen, chest, back, development of muscles, bones, adipose tissue.
- Assessment of the harmony of developmental features based on the ratio of height and body weight.
A comprehensive assessment of physical development, which is carried out in medical institutions, as well as during detailed medical examinations, allows, depending on the totality of data, to divide children into five different health groups:
- Group
I. This includes children without chronic diseases, not sick or rarely sick, developing physically and mentally without deviations. - Group II
. This group includes the category of children without chronic diseases and who get sick no more than four times a year, who have risks of developing chronic diseases; there may be minor deviations in the level of functioning of systems and organs. - Group III
defines children with chronic diseases, pathologies (congenital, which do not interfere with the body’s normal functioning), and who are often ill (more than four times a year). - IV group
. Children with developmental defects (congenital), chronic diseases that disrupt the normal well-being and general condition of the body. - V group
. This group includes children who suffer from serious chronic diseases that cause obvious disorders and disruptions in the functioning of the body.
WHO centile tables for assessing the physical development of girls - photo gallery
Height and weight of girls Chest and head circumference of girls Proportionality of height and weight of girls
Having brought your son to an appointment with a pediatrician, who will weigh him and measure his height, chest and head circumference, you hear an assessment of these indicators: a four, or another number from one to eight. What are these points? This is the centile corridor
, which contains your boy’s indicators according to the table. Centile tables are given below.
Dental tables for assessing the physical development of a child represent a kind of “mathematical photograph” of the distribution of a large number of children according to increasing indicators of height, weight, chest and head circumference. The practical use of these tables is extremely simple and convenient, combined with a good logical understanding of the assessment results.
The columns of centile tables show the quantitative boundaries of a trait in a certain proportion (percentage, centile) of children of a given age and gender. In this case, the values characteristic of half of healthy children of a given sex and age are taken as average or strictly normal values, which corresponds to the interval 25-50-75%. In our tables this interval is shaded. Intervals that are close to the average are assessed as below and above average (10-25% and 75-90%, respectively). These indicators can also be regarded by parents as normal. If the indicator falls into the zone of 3-10 or 90-97%, you should be wary and point this out to your doctor. This is an area of attention that requires additional consultation and examination. If the child’s indicator goes beyond 3 or 97%, it is very likely that the child has some kind of pathology that affects the indicators of his physical development. distribution of children by head circumference
You can understand what a dental scale is, for example a height scale, using the following example. Imagine 100 children of the same age and gender, lined up in height from smallest to tallest. The height of the first three children is assessed as very low, from 3 to 10 - low, 10-25 - below average, 25-75 - average, 75-90 - above average, 90-97 - tall and the last three guys are very tall.
The indicator of height, weight, etc. of a particular child can be placed in its own “corridor” of the centile scale of the corresponding table. Depending on which “corridors” the child’s anthropometric data fall into, a value judgment is formulated and an appropriate tactical medical decision is made.
The same principle is used to assess the correspondence of body weight to the length and height of a child, while the distribution is constructed using weight indicators for children of the same height.
An example of assessing the physical development of a newborn boy
Height-length - 50 cm, corresponds to “average” indicators. Weight - 3800 g, corresponds to the rating of “above average”. Chest circumference - 37 cm, corresponds to the rating "wide". Head circumference - 36cm, corresponds to “average” values. The correspondence of weight to the length of the child’s body is a moderate excess of weight relative to length, “above average.” To assess the sufficiency of nutrition in schoolchildren, one should use centile scales of the Quetelet index, which most objectively reveals both insufficiency and excess of body weight relative to height and depends little on the characteristics of the child’s physique and constitution.
Percentile tables for estimating height and weight of boys and girls from 2 to 20 years old. In Fig. Figures 1 and 2 show height values for boys and girls. Centile tables (or graphs) show quantitative boundaries of height and body weight.
The tables are compiled for boys and girls of different ages in terms of height, weight, chest and head circumference. How your baby is growing is a simple and accurate way to determine his or her overall health and development.
Teenagers
Assessment of the physical development of adolescents does not differ from assessment methods used for all children. All tables and scales include data for children under 17 years of age.
Although, of course, we must not forget that the development of girls after nine years and boys after eleven will differ significantly from the development of younger children.
During adolescence, significant changes occur in body proportions and the development of organs and systems:
- Girls under 14 years of age are significantly ahead of their peers in terms of weight, height,
- During this period, a strong growth spurt occurs (girls will have time to grow by about 25 centimeters and add 25 kilograms; boys - 35 centimeters and 35 kilograms).
- By the age of 13-15, the formation of secondary sexual characteristics will be completely completed.
- The active formation of the nervous, mental, cardiovascular, and endocrine systems continues.
- Pulse and pressure are gradually approaching those of an adult and at the age of 18 they will stop at 120 over 65 for girls and 115 over 60 for boys.
It is worth noting that the accelerating pace of physical development (acceleration) has recently significantly changed the norms of somatic indicators.
Good afternoon, visitor to my blog!
In general, the growth and development of my child has never made me think about the presence of any health problems, which I am incredibly happy about. This question interested me 21 months after Maxim’s birth, when I accidentally came across centile tables on the Internet. The analysis of my child's growth chart surprised me a little and at the same time reassured me.
Child's height and weight by month | WHO standards| Centile tables of physical development
Good afternoon, visitor to my blog!
In this article I want to share with you the height and weight, chest and head circumference of my child by month. Of course, weight and height gains in children are completely different, since each human body is individual. But, be that as it may, there are certain norms for increases.
Looking ahead, I will say that these norms are not a panacea and deviations from them, even significant ones, do occur even in healthy children.
Some pediatricians calculate the correspondence between weight and height using certain formulas, others rely on WHO recommendations, others on the norms of centile tables, which will be discussed below, and still others take into account other tables of height and weight of children.
In general, the growth and development of my child has never made me think about the presence of any health problems, which I am incredibly happy about. This question interested me 21 months after Maxim’s birth, when I accidentally came across centile tables on the Internet. The analysis of my child's growth chart surprised me a little and at the same time reassured me.
Centile tables of physical development. What it is?
A centile is an indicator of a specific parameter that has a specific number of surveyed children of the same age. The use of these tables in practice is absolutely simple and convenient, and is also combined with a good logical understanding of the assessment results.
The markings of centile tables are different: they can take the form of several tables or graphs, but their essence does not change.
You can understand what a centile scale is, for example, for height, using the following example: to measure 100 healthy children of the same age and gender, they lined them up in one row according to height: from the shortest to the tallest.
Growth from the 1st to the 3rd child is assessed as very low, from the 3rd to the 10th child - low, from the 10th to 25th - below average, from the 25th to 75th - average, from 75 to 90 - above average, from 90 to 97 - high and the last three children - very high.
The indicators belonging to half of healthy children of a given sex and age are taken as average or normal, which corresponds to the range of 25-75%. In the tables, this interval is marked in pink.
Physical development centile tables for girls:
body weight and length for a certain age
chest circumference – head circumference
body weight for a certain height
Centile tables of physical development for boys:
body weight and length for a certain age
chest circumference – head circumference
body weight for a certain height
The numbers from 1 to 8 located between the columns of the table are called corridors . Intervals that are close to the average (normal) values are rated as below and above average (namely, the 10-25% interval (corridor 3) and the 75-90% interval (corridor 6)).
These indicators for parents can also be assessed as normal. If the indicator falls within the range of 3-10% (corridor 2) or 90-97% (corridor 7), then you should pay attention to this, while remaining calm.
Intervals of 3-10% (corridor 2) and 90-97% (corridor 7) are the so-called zones of attention, which require additional examinations and consultations with specialists.
If any indicator of a child’s physical development goes beyond the values of 3% (corridor 1) or 97% (corridor down or up, respectively), then there is a possibility that the child has a pathology that affects the indicators of his physical development.
How to evaluate the proportionality of physical development using centile tables?
The easiest option is to look at how many columns (corridors) your child’s indicators are located within.
At a routine appointment at the clinic, the child’s height, weight, head and chest circumference are measured and they are looked at to which columns or spaces between them (corridors) they belong.
If all indicators are within one column or one corridor, or the difference between them is no more than one column, we can talk about the proportionality of physical development.
If the difference between the parameters is two columns, doctors talk about disproportionate or disharmonious development; three or more columns indicate sharply disharmonious development. If you look below at the table of my child’s physical development, you will see that once we had a difference between the indicators of 4 (!!!) columns, and more than once there is a difference of 3, and even more so 2 columns.
What to do if there is disharmonious development?
First of all, stop panicking! If disharmonious development in your case is a disease, then it will be revealed during a further full examination. But this can often be the norm for your child.
Measurements carried out in different countries and on different groups of children differ. And this is easily explained, because the average Western European is clearly taller than the average Chinese.
Therefore, be curious about what tables (whose production) you and the pediatricians at the site use when assessing parameters.
Secondly, it
may be heredity , which cannot be avoided.
If the child’s father and mother are tall and thin, then you should not be surprised if the pediatrician notices disproportionate development in their child, with tall stature and thinness.
And in our case, heredity did not pass by: Maxim’s dad is very tall and densely built, while his mother, on the contrary, is short and thin. The child has someone to be tall and thin, but I wouldn’t say that Maxim is thin, he’s more likely just not chubby). So remember:
Deviation from the norm relative to standard charts is not a diagnosis, it is just another reason to pay attention and be examined at the time of the presence of diseases
We were not examined, and I will say more - we were not referred, since the child grows and develops in leaps and bounds. Over the course of a month, his appetite and mood periodically change. At different periods of life, a child assimilates food that is often new to him in different ways and adapts to environmental conditions.
Given all this, expecting a specific indicator at a certain point in the measurement is completely wrong.
The main criteria for assessing the health status of an infant are behavior, sleep, healthy appearance, appropriate growth, normal regular bowel movements and comparison of anthropometric indicators of physical development with previous ones.
Indicators of normal growth and development of children according to WHO recommendations
WHO is the world health organization. For a long time, WHO specialists developed general average standards for the growth and development of children around the world. But this is wrong! Children, what are children, people from different countries differ very much in height, weight and numerous other parameters. And in 2006, WHO developed new child growth standards taking into account regions.
Current norms for height and weight of children in Russia download for free
According to WHO recommendations, the weight of a child under 2 years of age must be measured as follows: the mother stands on the scales, her weight is reset to zero when the woman is on the scales, then the naked child is given to the mother in her hands and the scales will show the baby’s weight!
In children's clinics in our city, the weight of babies is measured on special scales, on which a diaper is placed with the child.
What I don’t like about this method of weighing is that the child sometimes cries, and when he gets older, he even tries to get off the scale or stand up. There have been cases where children simply carried the scales off the cabinet.
In the mother's arms, the baby does not feel discomfort when weighed and those around him do not have to listen to the heart-rending screams of children - this is very humane for everyone.
My child's physical development chart:
| age | Height/length, cm | corridor | Weight, g | corridor | Head circumference, cm | corridor | Chest circumference, cm | corridor |
| At birth | 50 | 4 | 3000 | 3 | 33 | 2 | 32 | 2 |
| 1 month | 56 | 6 | 4410 | 5 | 37 | 4 | 38 | 6 |
| 2 months | 61 | 8 | 5300 | 5 | 39 | 4-5 | 38 | 4 |
| 3 months | 62 | 6 | 6170 | 5 | 40 | 4 | 39 | 5 |
| 4 months | 66 | 7 | 6950 | 5 | 41 | 4 | 40 | 4 |
| 5 months | 66 | 6 | 7200 | 5 | 42 | 4 | 41 | 3 |
| 6 months | 69 | 6 | 7600 | 4-5 | 43 | 4 | 43 | 4 |
| 7 months | 69 | 5 | 7880 | 4 | 44 | 4 | 44 | 4 |
| 8 months | 70 | 4-5 | 8000 | 3-4 | 45 | 4 | 45 | 4 |
| 9 months | 72,5 | 5 | 8470 | 4 | 45 | 4 | 45 | 3 |
| 10 months | 73 | 4-5 | 8800 | 3-4 | 45 | 4 | 45 | 2 |
| 11 months | 75 | 5 | 9120 | 4 | 46 | 3 | 46 | 3 |
| 1 year | 76 | 5 | 9200 | 3 | 46 | 3 | 46,5 | 3 |
| 1 year 3 months | 80 | 5 | 10200 | 4 | 46 | 2 | 48 | 4 |
| 1 year 6 months | 83 | 5 | 10500 | 3 | 47 | 3 | 49 | 4 |
| 1 year 9 months | 84 | 4 | 11000 | 3 | 49 | 5 | 51 | 5 |
| 2 years | 88 | 5 | 12000 | 4 | 49 | 4 | 51 | 4 |
Having analyzed the table indicators as a whole, it is easy to notice:
- Within the same age, there are differences in readings of up to 4 corridors, and often they amount to 3-2 corridors.
- According to theory, Maxim’s ideal harmonious physical development occurs only during a period of 7 months.
- The huge growth spurts after birth, which shocked me when analyzing the table, settled down by 6 months and at the age of one year Maxim had an absolutely average height.
- After 4 months, weight gain stabilizes and its indicators are not as high as in the first months. This is completely normal.
In fact, there is no need to feed the child; his body itself knows the amount of food it needs for normal life. Excess body weight will hinder the child’s physical development: it will be more difficult for the baby to roll over from side to side, crawl, and so on. But a healthy child is a thin baby with an awl in the butt.
Also, by forcing a child to eat more than he wants, you stretch the child’s stomach; subsequently, the child will get used to eating more than he should and a new problem will arise: how to reduce the child’s appetite. After all, a fat child, and especially a teenager, will not cause tenderness in anyone, rather, on the contrary. Look at the sample menu for a 1 year old child.
In conclusion, I would like to note that Maxim is healthy and developing in accordance with his age. Therefore, I urge mothers not to panic, but to monitor the growth and development of their child over time! And our practice once again confirms this.
It is much more important, more necessary, and more useful to engage in the development of a child and care for him than to independently look for and invent diseases that, in principle, do not concern your child.
I’m also very interested in whether your baby had similar leaps in physical development? What interesting moments and patterns did you notice/are you noticing during your growth? Many mothers note that with the introduction of complementary foods, the weight of their children increases sharply.
In our case, this was not observed, probably because complementary feeding began with vegetable purees, and not with cereals.
Grow and develop for the joy of everyone!
Source: https://mame55.ru/rost-i-ves-rebenka-normy-voz-centilnye-tablicy/
Centile tables of physical development. What it is?
Centile
- this is an indicator of a specific parameter that has a specific number of surveyed children of the same age. The use of these tables in practice is absolutely simple and convenient, and is also combined with a good logical understanding of the assessment results.
The markings of centile tables are different: they can take the form of several tables or graphs, but their essence does not change.
You can understand what a centile scale is, for example, for height, using the following example: to measure 100 healthy children of the same age and gender, they lined them up in one row according to height: from the shortest to the tallest. Growth from the 1st to the 3rd child is assessed as very low, from the 3rd to the 10th child - low, from the 10th to 25th - below average, from the 25th to 75th - average, from 75 to 90 - above average, from 90 to 97 - high and the last three children - very high. The indicators belonging to half of healthy children of a given sex and age are taken as average or normal, which corresponds to the range of 25-75%. In the tables, this interval is marked in pink.
Physical development centile tables for girls:
Centile tables of physical development for boys:
The numbers from 1 to 8 located between the columns of the table are called corridors
. Intervals that are close to the average (normal) values are rated as below and above average (namely, the 10-25% interval (corridor 3) and the 75-90% interval (corridor 6)). These indicators for parents can also be assessed as normal. If the indicator falls within the range of 3-10% (corridor 2) or 90-97% (corridor 7), then you should pay attention to this, while remaining calm. Intervals of 3-10% (corridor 2) and 90-97% (corridor 7) are the so-called zones of attention, which require additional examinations and consultations with specialists. If any indicator of a child’s physical development goes beyond the values of 3% (corridor 1) or 97% (corridor down or up, respectively), then there is a possibility that the child has a pathology that affects the indicators of his physical development.
How to evaluate the proportionality of physical development using centile tables?
The easiest option is to look at how many columns (corridors) your child’s indicators are located within. At a routine appointment at the clinic, the child’s height, weight, head and chest circumference are measured and they are looked at to which columns or spaces between them (corridors) they belong. If all indicators are within one column or one corridor, or the difference between them is no more than one column, we can talk about the proportionality of physical development. If the difference between the parameters is two columns, doctors talk about disproportionate or disharmonious development; three or more columns indicate sharply disharmonious development. If you look below at the table of my child’s physical development, you will see that once we had a difference between the indicators of 4 (!!!) columns, and more than once there is a difference of 3, and even more so 2 columns.
What to do if there is disharmonious development?
First of all, stop panicking! If disharmonious development in your case is a disease, then it will be identified during a further full examination. can often
for your child. Measurements carried out in different countries and on different groups of children differ. And this is easily explained, because the average Western European is clearly taller than the average Chinese. Therefore, be curious about what tables (whose production) you and the pediatricians at the site use when assessing parameters.
Secondly, it could be heredity
, from which you can’t escape. If the child’s father and mother are tall and thin, then you should not be surprised if the pediatrician notices disproportionate development in their child, with tall stature and thinness. And in our case, heredity did not pass by: Maxim’s dad is very tall and densely built, while his mother, on the contrary, is short and thin. The child has someone to be tall and thin, but I wouldn’t say that Maxim is thin, he’s more likely just not chubby). So remember:
Deviation from the norm relative to standard charts is not a diagnosis, it is just another reason to pay attention and be examined at the time of the presence of diseases
We were not examined, and I will say more - we were not referred, since the child grows and develops in leaps and bounds. Over the course of a month, his appetite and mood periodically change. At different periods of life, a child assimilates food that is often new to him in different ways and adapts to environmental conditions. Given all this, expecting a specific indicator at a certain point in the measurement is completely wrong. The main criteria for assessing the health status of an infant are behavior, sleep, healthy appearance, appropriate growth, normal regular bowel movements and comparison of anthropometric indicators of physical development with previous ones.
WHO is the world health organization. For a long time, WHO specialists developed general average standards for the growth and development of children around the world. But this is wrong! Children, what are children, people from different countries differ very much in height, weight and numerous other parameters. And in 2006, WHO developed new child growth standards
taking into account regions.
Current norms for height and weight of children in Russia download for free
According to WHO recommendations, the weight of a child under 2 years of age must be measured as follows: the mother stands on the scales, her weight is reset to zero when the woman is on the scales, then the naked child is given to the mother in her hands and the scales will show the baby’s weight!
In children's clinics in our city, the weight of babies is measured on special scales, on which a diaper is placed with the child. What I don’t like about this method of weighing is that the child sometimes cries, and when he gets older, he even tries to get off the scale or stand up. There have been cases where children simply carried the scales off the cabinet. In the mother's arms, the baby does not feel discomfort when weighed and those around him do not have to listen to the heart-rending screams of children - this is very humane for everyone.
My child's physical development chart:
| age | Height/length, cm | corridor | Weight, g | corridor | Head circumference, cm | corridor | Chest circumference, cm | corridor |
| At birth | 50 | 4 | 3000 | 3 | 33 | 2 | 32 | 2 |
| 1 month | 56 | 6 | 4410 | 5 | 37 | 4 | 38 | 6 |
| 2 months | 61 | 8 | 5300 | 5 | 39 | 4-5 | 38 | 4 |
| 3 months | 62 | 6 | 6170 | 5 | 40 | 4 | 39 | 5 |
| 4 months | 66 | 7 | 6950 | 5 | 41 | 4 | 40 | 4 |
| 5 months | 66 | 6 | 7200 | 5 | 42 | 4 | 41 | 3 |
| 6 months | 69 | 6 | 7600 | 4-5 | 43 | 4 | 43 | 4 |
| 7 months | 69 | 5 | 7880 | 4 | 44 | 4 | 44 | 4 |
| 8 months | 70 | 4-5 | 8000 | 3-4 | 45 | 4 | 45 | 4 |
| 9 months | 72,5 | 5 | 8470 | 4 | 45 | 4 | 45 | 3 |
| 10 months | 73 | 4-5 | 8800 | 3-4 | 45 | 4 | 45 | 2 |
| 11 months | 75 | 5 | 9120 | 4 | 46 | 3 | 46 | 3 |
| 1 year | 76 | 5 | 9200 | 3 | 46 | 3 | 46,5 | 3 |
| 1 year 3 months | 80 | 5 | 10200 | 4 | 46 | 2 | 48 | 4 |
| 1 year 6 months | 83 | 5 | 10500 | 3 | 47 | 3 | 49 | 4 |
| 1 year 9 months | 84 | 4 | 11000 | 3 | 49 | 5 | 51 | 5 |
| 2 years | 88 | 5 | 12000 | 4 | 49 | 4 | 51 | 4 |
In conclusion, I would like to note that Maxim is healthy and developing in accordance with his age. Therefore, I urge mothers not to panic, but to monitor the growth and development of their child over time! And our practice once again confirms this. It is much more important, more necessary, and more useful to practice than to independently look for and invent diseases that, in principle, do not concern your child. I’m also very interested in whether your baby had similar leaps in physical development? What interesting moments and patterns did you notice/are you noticing during your growth? Many mothers note that with the introduction of complementary foods, the weight of their children increases sharply. In our case, this was not observed, probably because complementary feeding began with vegetable purees, and not with cereals.
Be healthy! Grow and develop for the joy of everyone!
What are centile tables? You can understand what a centile scale is, for example, height, using the following example. Imagine 100 children of the same age and gender, lined up in height from smallest to tallest. The height of the first three children is assessed as very low, from the 3rd to the 10th - as low, 10-25th - as below average, 25-75th - as average height. The height of 75-90 is rated as above average, 90-97 as tall and the last three guys as very tall.
How to use it if you know your child’s height and weight
Using tables is simple and convenient. You need to weigh and measure the baby, find his age and see which corridor his data falls into. The centile corridor is the interval on the centile scale that corresponds to your child’s performance.
For convenience, the centile corridors are designated by numbers from 1 to 8, and the columns indicating the norm are highlighted in color. Indicators on the left (1–3) and on the right (6–8) are rated as below and above the average. Corridors 2 and 7 are areas of focus that may require additional consultation. Corridors 1 (very low) and 8 (very high) - there is a possibility of developmental pathology. Under the corridor numbers, the quantitative boundaries of the trait are indicated for a certain proportion (percentage, centile) of children of a given age and gender.
Example: boy, age 3 months. Determine the level of his physical development using the tables:
- body length - 60 cm, average (corridor 5);
- weight - 5600 g, average (corridor 4);
- chest circumference - 39 cm, average (corridor 5);
- head circumference - 40 cm, average (corridor 4).
What tables do Russian doctors use?
Centile tables are published in textbooks and manuals on pediatrics, pediatrician's reference books and other medical literature. I suggest you familiarize yourself with the tables from the Pediatrician's Handbook, ed. V.O. Bykova (Stavropol, 2004). They correspond to the data given in the books “Propaedeutics of Childhood Diseases,” ed. A.V. Mazurin and I.M. Vorontsov (St. Petersburg, 2000) and “Propaedeutics of Childhood Diseases,” ed. N.A. Geppe (M., Geotar-Media, 2008).
- Centile tables. Body weight of boys and girls from 0 to 17 years.
- Centile tables. The height of boys and girls from 0 to 17 years.
- Centile tables. Dependence of weight on height in boys and girls.
- Centile tables. Chest circumference in boys and girls from 0 to 17 years.
- Centile tables. Head circumference of boys and girls from 0 to 16 years.
Are there more modern centile tables?
Yes, they were compiled in 2005 by experts from the World Health Organization (WHO) based on the results of the Multifocal Growth Reference Study (MGRS), conducted in 1997-2003. Centile tables are always the result of a study of a large number of healthy children: data on weight, height, head circumference, etc. of thousands of children are analyzed, statistically processed and entered into tables. These may be children living in the same country or territory, or in different regions of the world. This is exactly what the latest WHO study was like. What made it different from previous ones was that it involved children who were cared for in accordance with WHO health guidelines, such as breastfeeding and maternal cessation of smoking. Today, the MGRS results are recognized international standards with which the development of children can and should be compared, regardless of their place of residence, type of feeding, and belonging to different ethnic groups and cultures.
I offer you the following WHO tables:
These data were taken from the website of the World Health Organization and were adapted by me for ease of perception into tables with multi-colored columns.
How to use WHO tables correctly:
- Find the line that matches the child's age.
- Determine between which values in this row the child’s weight/height lies: - between the indicators in the columns -1 SD and 1 SD.
This is
an area of average values, half of healthy children of a given age have the same weight/height; - between the indicators of the columns -3 SD and -1 SD, 1 SD and 3 SD. These are areas of reduced or increased weight/height; such children in the population are about 44%, and this is also a variant of the norm. Lower/higher weight/height may be associated with genetic characteristics (for example, such as the height of parents, the weight of the child at birth), constitutional and metabolic characteristics; - the weight (height) value exceeds the indicators of the -3 SD and 3 SD columns. Such values are a reason to consult a doctor to examine the child and find out the reasons for the lag/advance in weight/height. Although about 6% of healthy children have the same indicators.
Hello, dear readers!
What do you think new parents worry about? After all, after the birth of a baby, the life of young fathers and mothers changes in the most miraculous way - delight and tenderness are replaced by the daily work of caring for a newborn. This is where the first fears and worries begin. During scheduled monthly visits, a pediatrician’s head is bombarded with a lot of questions.
How much has the baby gained in height and weight? As a rule, the main concerns of “inexperienced” parents are the compliance of these indicators with the generally accepted norm. I admit, at one time I was also tormented by doubts about the above-mentioned indicators. However, the doctor reassured me - there is a table for the development of a child up to one year, which shows the norms for height, weight, as well as the increase in indicators for each month.
So, let's take a fascinating journey from the moment the baby is born until he is one year old. After all, kids grow up so fast! And how many skills little “researchers” master during this period - just keep up with them!
When I first heard about this term from my local pediatrician, I didn’t immediately understand what was going on. However, there is nothing “scary” here - we are talking about anthropometric indicators for assessing the child’s development (height, weight, head and chest circumference).
“Your baby’s height is in the fifth corridor,” says your “children’s” doctor. This means that the child's height, which is assessed using a special centile table, is average.
It is noteworthy that the normative indicators for boys and girls are slightly different.
At the next scheduled examination, the pediatrician takes all the necessary measurements, compares them with the data in the tables and, on this basis, makes a conclusion about the child’s development. Today, if desired, mothers can find these signs on special thematic websites. However, it’s still better to consult a pediatrician, isn’t it? The doctor will teach you how to use centile tables correctly, and will also “dispel” possible doubts and worries.
For example, indicators corresponding to the intervals of 25 – 50 – 75% are considered average. And if, after measurements and assessments, the baby is classified as 3 - 10% or 90 - 97%, then this is a reason to be wary and immediately consult a doctor.
How to use the centile table?
Scientists are constantly trying to create normative tables for analyzing any indicators, and especially those that change greatly with age. Centile tables of physical development of girls and boys are designed to assess the growth and condition of the child. The tables have a line corresponding to the child's age. Its actual weight is measured and compared with the values presented in the table. Average weight is considered to be between 25-75%. If the gap is 10-25%, then the weight is below average. Weight above average falls in the range of 75-90%, 3-10% - low weight, up to 3% - very low weight, 90-97% - high weight, more than 97% - very high weight.
To understand the essence of the centile table, you can imagine a line of, say, a hundred children who stand in accordance with their height from the smallest child to the tallest. The first babies will be considered very short, children from 3 to 10 tall will be simply short. Next come children below average height, children from 25 to 75 - average height, up to 90 - above average. Until 1997, there are tall kids, and the last kids will be very tall. In the same way, one can imagine the correspondence between head circumference, body weight and chest.
At the same time, the centile table for girls, and even for boys, determines the quantitative boundaries of the trait in some children. That’s why the table has the name “centile” - percentage or part. The interval 25-50-75% is typical for most healthy children of the same age and gender. Low height ratios may indicate the presence of a developing or existing disease, but if the data in the table are harmoniously combined, then this indicates the physique characteristics of a particular child.
Your child's height will be measured during the first twelve months of life and then until age 17. It is worth noting that the tables for girls and boys have different indicators, since children of different sexes develop differently. Girls begin puberty earlier, and boys grow faster.
At the same time, take into account the fact that many pediatricians may use outdated Soviet-style tables, that is, according to them, your child may not fit into the norm. Therefore, be sure to check the compliance of the tables with the latest standards recommended by WHO.
Having brought your baby to an appointment with a pediatrician, who will weigh her and measure her height, chest and head girth, you hear an assessment of these indicators: a four, or another number from one to eight. What are these points? This is the centile corridor
, which contains your girl’s indicators according to the table.
Using the tables, you can find out whether your child’s height and weight at a given age (from birth to 17 years) are normal. Centile tables are given below.
Dental tables for assessing the physical development of a child represent a kind of “mathematical photograph” of the distribution of a large number of children according to increasing indicators of height, weight, chest and head circumference. The practical use of these tables is extremely simple and convenient, combined with a good logical understanding of the assessment results.
The columns of centile tables show the quantitative boundaries of a trait in a certain proportion (percentage, centile) of children of a given age and gender. In this case, the values characteristic of half of healthy children of a given sex and age are taken as average or strictly normal values, which corresponds to the interval 25-50-75%. In our tables this interval is shaded. Intervals that are close to the average are assessed as below and above average (10-25% and 75-90%, respectively). These indicators can also be regarded by parents as normal. If the indicator falls into the zone of 3-10 or 90-97%, you should be wary and point this out to your doctor. This is an area of attention that requires additional consultation and examination. If the child’s indicator goes beyond 3 or 97%, it is very likely that the child has some kind of pathology that affects the indicators of his physical development. distribution of children by head circumference
You can understand what a dental scale is, for example a height scale, using the following example. Imagine 100 children of the same age and gender, lined up in height from smallest to tallest. The height of the first three children is assessed as very low, from 3 to 10 - low, 10-25 - below average, 25-75 - average, 75-90 - above average, 90-97 - tall and the last three guys are very tall.
The indicator of height, weight, etc. of a particular child can be placed in its own “corridor” of the centile scale of the corresponding table. Depending on which “corridors” the child’s anthropometric data fall into, a value judgment is formulated and an appropriate tactical medical decision is made.
The same principle is used to assess the correspondence of body weight to the length and height of a child, while the distribution is constructed using weight indicators for children of the same height.
Percentile tables for estimating height and weight of boys and girls from 2 to 20 years old. In Fig. Figures 1 and 2 show height values for boys and girls. Centile tables (or graphs) show quantitative boundaries of height and body weight.
The tables are compiled for boys and girls of different ages in terms of height, weight, chest and head circumference. How your baby is growing is a simple and accurate way to determine his or her overall health and development.